
At PSIORI, I have been working on one of our very first products, namely the PSIORI Visualizer. It enables you to visualize high dimensional data in a 3D point cloud. It uses state of the art machine learning, to embed millions of data points and renders them in real time. Explore your data in 3D and select interesting points or regions for further investigation.
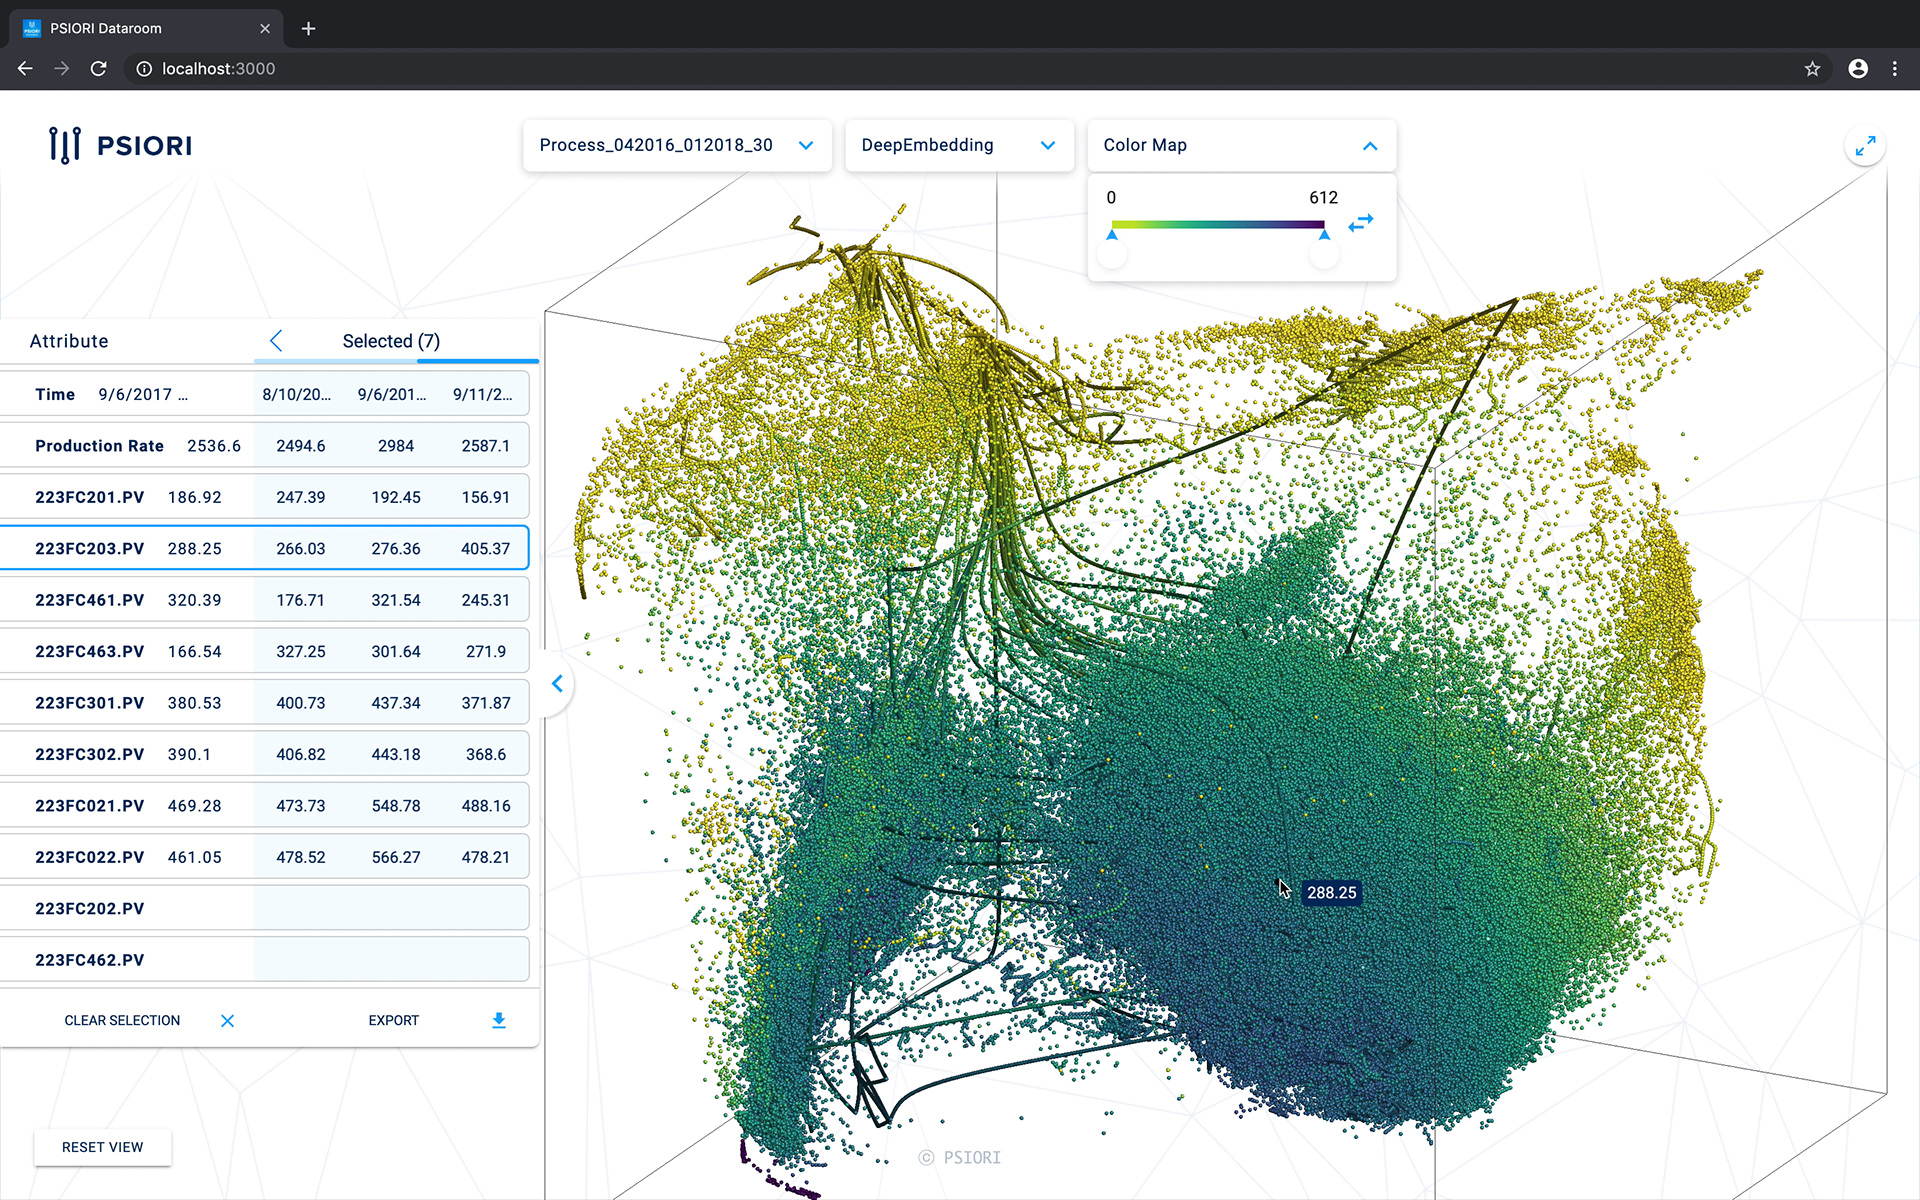
In this project I played a leading role in the frontend implementation and developing the user experience and interface.
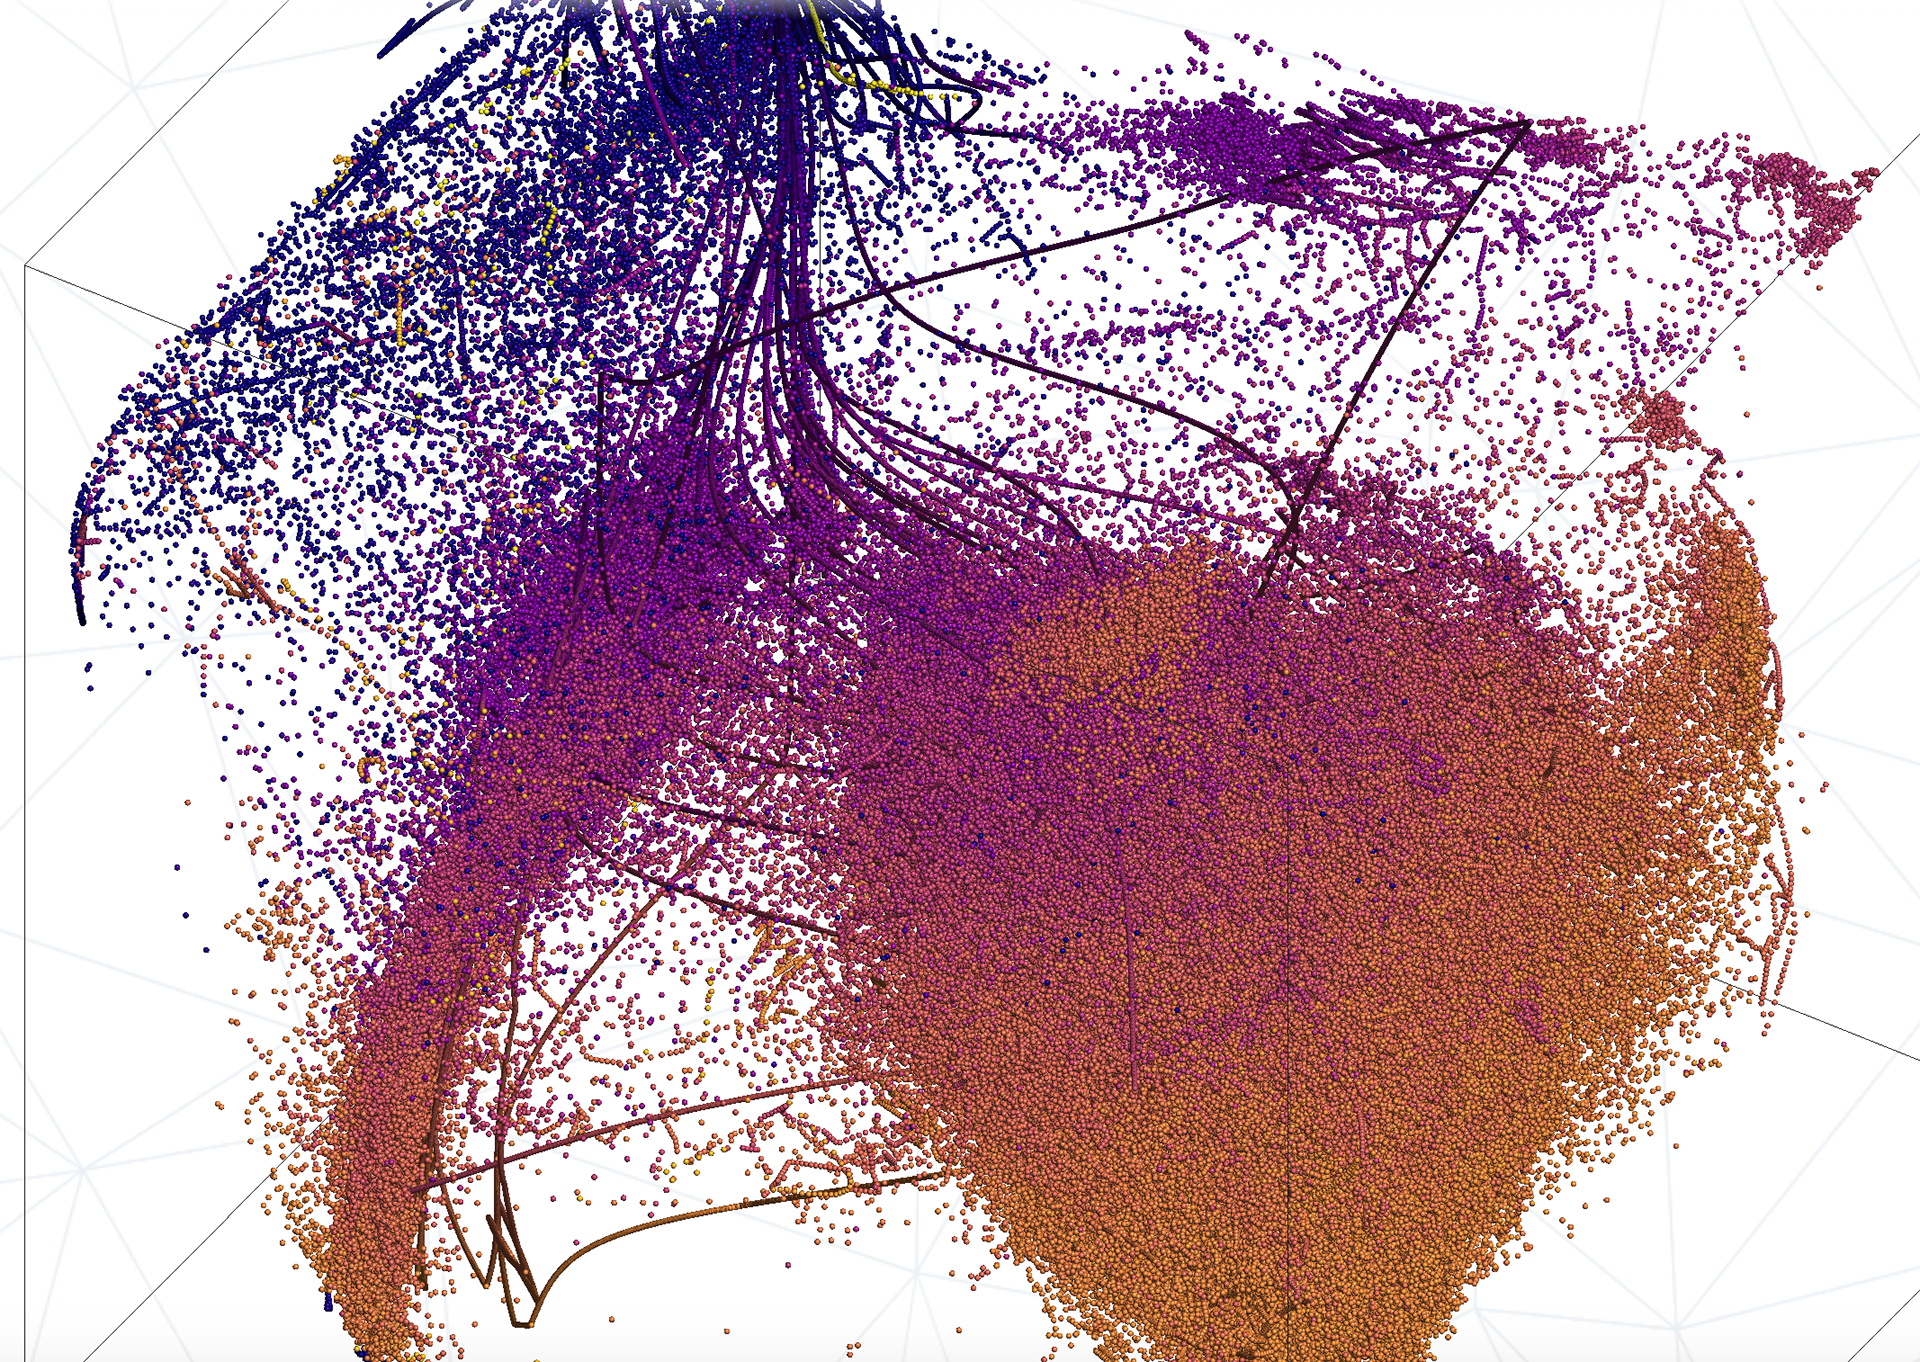
Choose from categorical or sequential colormaps to best represent your data and find outliers or trends.
You can find out more about the Visualizer on the PSIORI website